
Teaching with Precision with Rick Kubina
/Dr. Richard Kubina is Professor of Special Education in Penn State’s College of Education where he teaches courses on reading methods, informal assessment, and behavior analysis. Dr. Kubina also conducts wide-ranging research in the areas of Applied Behavior Analysis and Precision Teaching. Previously, he taught special education in schools specializing in post-acute brain trauma rehabilitation. Dr. Kubina is a Board Certified Behavior Analyst, Doctoral-level and has served as the editor of the Journal of Precision Teaching and Celeration.
WHAT IS PRECISION TEACHING?
Thriving Schools: Professor Kubina, in addition to teaching special education, you do really fascinating work in other areas. Can you describe that for us?
Rick: My larger area of work is in Precision Teaching, a method that involves pinpointing student behaviors, measuring them with proper dimensional units, using specialized visual displays, and engaging in recursive problem-solving to improve outcomes. Put more simply, you can think of the process as pinpoint, record, change, and try again. The exciting part is this. The folks who’ve been following this process over the decades have found there are certain learning frequencies (for example, typing at 40 words per minute), that when achieved, dramatically improve a student’s academic fluency. And I now have an education software company called Chartlytics that supports educators in acting on these insights.
If you want to improve an outcome, you have to be able to accurately detect what the behavior is you’re interested in changing. If you can’t detect it, then you can’t count it properly. And if you can’t county it properly, you can’t accurately determine whether a student is improving.
Thriving Schools: Can you tell us more about the work you do at Chartlytics?
Rick: At Chartlytics we work with schools to measure student behaviors, including achievement and work with disabilities. From there, we help them apply specific skills that help develop academically fluent students. And we’ve found teachers are able to produce incredibly robust outcomes with kids in very short periods of time. Even more exciting, the accessibility of technology now allows students to self-monitor their progress (on iPads for example) and make their own decisions about next steps. And when this happens, students own their learning and become highly motivated!
3 PROBLEMS IN SPECIAL EDUCATION
Thriving Schools: Given your work in Precision Teaching and your review of the academic literature, what practices do we need to discontinue in working with students’ disabilities?
Rick: I’ll give you 3, just in the area of measurement! Your readers will know that in special education, we use IEPs that detail a student’s goals and the required action steps to meet them. And often these documents begin by listing what are called “operation definitions.” For example, aggression could be defined as a person attempting or actually hitting, biting, kicking, or throwing something. Then, the IEP will usually go on to rattle off 3-5 additional items that are part of that operational definition. In the aggression example, that means if there are 5 items in the operational definition, the teacher has to be able to quickly and accurately identify those items. But the tricky part is this – that’s just 1 student and 1 behavior. When you start multiplying how many students you have with disabilities and how many operational behaviors each of them have, you can see that the task of monitoring all of these behaviors becomes impossible.
Thriving Schools: And what are the ramifications of this?
Rick: If you want to improve an outcome, you have to be able to accurately detect what the behavior is you’re interested in changing. If you can’t detect it, then you can’t count it properly. And if you can’t county it properly, you can’t accurately determine whether a student is improving. These are all the downstream effects of starting with an operational definition.

Thriving Schools: Is it also fair to assume that not all of the items included in an operational definition are demonstrated in each instance of the behavior?
Rick: Absolutely. You nailed it.
Thriving Schools: We’ll come back and address how to fix this issue, but let’s get clear on the other 2 problems you mentioned. What do you see as being the 2nd big problem with how we measure behaviors in special education?
Rick: The second big issue (that stems from what I just mentioned) is how we count behaviors. Teachers, by and large, use what we call “dimensionless quantities.” An example of this might be a teacher monitoring a student’s “percent correct” on a particular task. But this causes all kinds of problems! For starters, it ignores time. For instance, let’s say you have 2 students with scores of 90% on some math work they’ve done. Which one is better? Well if the first student completed 9/10 problems in the same time it took the 2nd student to do 18/20, you’d say the 2nd student is doing way better (because they’re completing twice the number of problems in the same amount of time). So having these dimensionless quantities can mask the true nature of a student’s skill.
Thriving Schools: And what’s the 3rd issue you’d want to address?
Rick: The third issue is how we graphically display the data for the behavior in question. Most people are accustomed to only using linear graphs, with time on the x-axis and a count on the y-axis. But a chart like this is too basic – it can only show us whether we have more or less of something. The problem with this is that it forces teachers into linear thinking. But behavioral changes and skill acquisition don’t progress linearly. They’re better shown on what we call a ratio graph, a chart that’s better able to show rate of change.
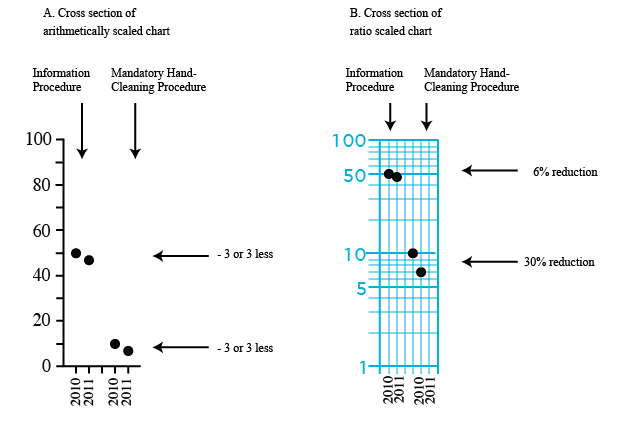
Prof. Kubina provided us with this example from medicine, comparing the difference between providing information on hand-washing versus mandatory hand-cleaning procedures. One can see the linear graph (on the left) shows how a 3 percentage point decline in two different instances “visually appears” the same, whereas, in the ratio graph (on the right) one can see that the same 3 percentage point change produces dramatically different percentage changes (6% vs. 30%). Ratio graphs better depict this difference.
Thriving Schools: What are the implications of this? Are we just splitting hairs?
Rick: We did research looking through approximately 2,000 graphs from published articles in special education trying to identify errors. And we found that 86% of these graphs contained mistakes. Furthermore, many of these errors would’ve led to dramatically different conclusions about the decisions to be made about students.
Thriving Schools: How do you think about more qualitative measures of student behavior, like student “time on task?”
Rick: People should just ban terms like “time on task” from their vocabulary. In precision teaching, what we do is to help teachers get very specific about the behaviors they’re addressing.
IMPROVING OPERATIONAL DEFINITIONS
Thriving Schools: Okay, let’s start helping educators understand how we fix these 3 big problems. Let’s come back to the first one - how do we address the issues around “operational definitions” to improve IEPs?
Rick: First, let me make clear the difference between an “operational definition” and a “behavioral objective.” A behavioral objective has 4 parts – the student, target behavior, conditions, and criterion. So here’s an example – let’s say I operationally define “happiness” as the number of smiles someone receives in a half hour. So today you might get 5 smiles, tomorrow 6, and maybe 10 smiles by the end of the week. And I can argue I’m making you happier because I’ve operationally defined happiness in this way. Now the problem with IEPs happens when teachers simply plug parts of the operational definition into the behavioral objectives.
Thriving Schools: So what should we do instead?
Rick: What we do in Precision Teaching is use what we call a “pinpoint,” a very specific formula you apply to a student’s behavior. Here’s the basic framework: you take an action verb, an object that receives that action, and a context in which you’re measuring it. And you can see that what we’re doing is helping teachers get more specific about the behavioral objective they want. When you master this type of language, you can inject it into the IEP and dramatically improve the quality of the document. An example of this might be, “Given a set of 5-10 assigned spelling words, a student will be able to spell them correctly in 4 out of 5 trials with 80% accuracy.”
Thriving Schools: Why aren’t teachers doing this already?
Rick: Unfortunately, I just think it’s a lack of awareness – they haven’t been shown how to do this. I do believe the vast majority of teachers will adopt practices that help them better work with students. So if we can show them a better way, they’re going to do it! We’re in a “helping” profession!
Thriving Schools: And what are teachers’ responses when you show them this?
Rick: “Why didn’t someone teach me this earlier?” or “Why didn’t I learn this in college?”
Stay tuned for Part 2 with Prof. Kubina! We'll take a deeper dive into Precision Teaching and see how we can solve the problems with dimensionless quantities and displaying student improvement!